Hostilities in the Gaza Strip and Israel - reported impact | Day 201

Day 201

KEY FIGURESSource: MoH GazaSource: GEDCOSource: UNRWASource: IPC projectionfor 16 March - 15 July 202434,262Palestinian fatalities~1.7millioninternally displaced persons (75% of Gaza)0hoursFull electricity blackout1.1 millionpeople projected to face catastrophic levels of food insecurity (IPC Phase 5)
¹¹º»¹¹¹º»EGYPTISRAELErezRafahKerem Shalom5 KmSufaKarniNahal OzDDDDDDDDDDDDDDDDDDDDDDDD®Mediterranean Sea60-Km-long Israeli fence12.6-Km-longEgyptian fenceClosed gradually between 2007 and 2011Closed since 2010Closed since 2008 (except Mar-Apr 2011)Permanently Closed CrossingCurrently Closed CrossingGazaRafah Wadi GazaACCESS PROHIBITEDPopulation2.3millionArea365 km2EGYPTJORDANSYRIALEBANONGAZASTRIPWESTBANKISRAELNitzanaAl ArishGAZASTRIPGazaNorth Deir al BalahSalah Ad Din roadCoastal roadKhan YounisEntry PointJetty PierIsraeliCheckpointIsraeli Military RoadIsraeliCheckpoint Closed

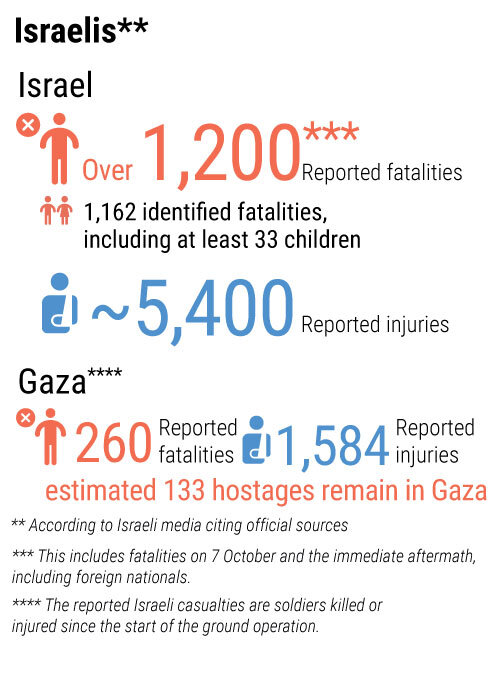
REPORTED CASUALTIES

(Cumulative) as of 24 April 2024

02000040000600008000024 AprDaily/cumulative7 OctREPORTED CASUALTIES (Cumulative) as of 24 April 2024Palestinians*34,262 Reported fatalities including>9,500 women (source: GMO)>14,500 children (source: GMO) *Source: MoH Gaza20232024200004000060000by 31 Jan 202427,131 by 29 Feb 202430,035by 31 Mar 202432,782by 31 Dec 202322,185 by 30 Nov 202315,207 by 31 Oct 20238,005 Not including more than 7,000 reported missing or under the rubble (source: GMO)
02000040000600008000024 AprDaily/cumulative7 OctREPORTED CASUALTIES (Cumulative) as of 24 April 202477,229*Source: MoH GazaReported injuries20232024by 31 Jan 202465,949by 31 Dec 202356,165by 30 Nov 202340,652by 31 Oct 202320,242by 31 Mar 202475,298by 29 Feb 202470,457

*Source: MoH Gaza

...
EDUCATIONHEALTHNUTRITIONSHELTER
WATER AND SANITATION* Source: IPC projection for 16 March - 15 July 2024FOOD SECURITY
PROTECTION
REPORTED DAMAGE
MOVEMENT AND ACCESS
INCOMING TRUCKLOADS*The pre-crisis average per working day in 2023 was 500 truckloads, including fuel.26 Jan1 Feb2-8Feb8178179349343303306316317797791,1471,1471,1471,1471,0861,0861,1741,1741,1741,1741,2841,2841,2281,2287-1213-1920-2627 Oct2 Nov3-9Nov10-16Nov17-23Nov24-30Nov1-7Dec8-14Dec15-21Dec22-28Dec29 Dec4 Jan5-11Jan12-18Jan19-25Jan20232024Daily average (by week)Daily totalOct Oct Oct 00007575300300411411383383385385120912095505507647648948946816819579571,0171,0171,0941,0941,0851,085Weekly totalsFeb9-15Feb16-22Feb23-29Mar1-7MarMar8-1415-21Mar22-28AprAprApr001143595555173 (Pause in hostilities)791081289713714515615613613347901111641641551684 Apr29 Mar1685-11Apr12-1818317519250202222118022316NAAprApr23Apr*Supplies observed or registered by the UN as entering through Kerem Shalom or Rafah. Other incoming supplies are not currently captured.

Disclaimer: The UN has so far not been able to produce independent, comprehensive, and verified casualty figures; the current numbers have been provided by the Ministry of Health or the Government Media Office in Gaza and the Israeli authorities and await further verification. Other yet-to-be verified figures are also sourced.